Social Housing Energy Upgrades Pass 50,000 Homes: What the Milestone Means
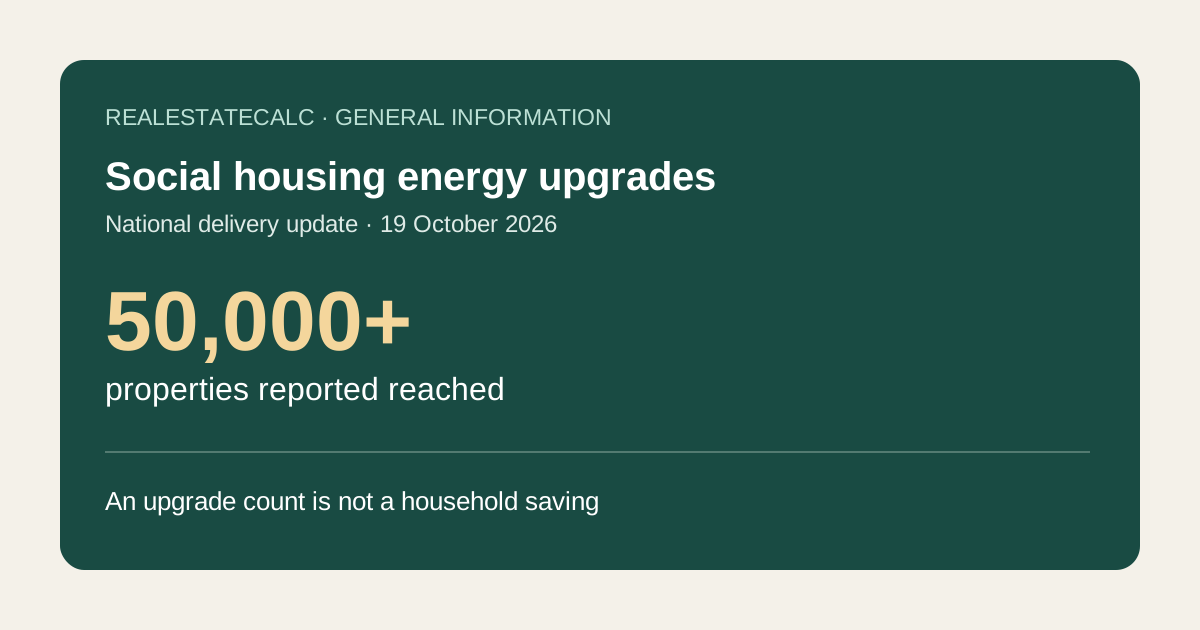
The 19 October SHEPI update reports more than 50,000 social housing properties upgraded. Separate national delivery figures from individual works and household bill savings.
Try the Rent-to-Income Ratio Calculator Australia
Run the numbers while you read and see how the concepts apply to your situation.
What was reported on 19 October?
The Australian Government reports that more than 50,000 social housing properties have benefited from its Social Housing Energy Performance Initiative (SHEPI). The 19 October 2026 release describes this as the halfway point towards a goal of improving more than 100,000 properties.
This is a national delivery update about existing homes. It is not an announcement that 50,000 new homes have been built, or a rebate offer to every renter or homeowner. Source: DCCEEW ministerial release.
What the numbers measure
| Measure in the release | Reported figure |
|---|---|
| Social housing properties reached | More than 50,000 |
| Program goal | More than 100,000 properties |
| Reverse-cycle air conditioners installed | 6,000 |
| Hot water heat pumps installed | 6,000 |
| Solar PV systems installed | 3,500 |
The equipment counts are not additional homes to add to the first row. A home can have several improvements, and the release does not provide a property-by-property breakdown.
The release describes a $1.1 billion initiative, including $800 million from the Australian Government, delivered with states and territories. It identifies insulation, draught proofing, glazing and electric appliances among possible works. It does not provide a confirmed saving or installation date for each address.
What a resident can check
For someone waiting for works, a national milestone answers a different question from a provider's appointment letter. Keep a simple record of what is actually confirmed for the property:
| Record | Question to resolve |
|---|---|
| Provider correspondence | Is this address included, and which works are confirmed? |
| Installation arrangement | Who confirms access, timing and any interruption to services? |
| Equipment handover | Where are the controls, operating instructions and fault contact? |
| Electricity bills | Which usage and tariff changes can be compared after the work? |
These are practical enquiry prompts, not program requirements or authority to commission works. Contact the housing provider for arrangements at a particular address. Do not pay an unsolicited contractor on the strength of this article.
The September NSW expansion report covers a separate, state-specific funding announcement and its delivery timetable. A national progress total does not bring forward an individual appointment under that expansion.
A lower bill and lower energy use are different measures
Here is an original, deliberately simplified example, unrelated to any SHEPI household. Assume a single electricity import tariff, no solar exports, no concessions or credits, and no supply-charge change.
| Item | Earlier 90-day period | Later 90-day period |
|---|---|---|
| Electricity used | 900 kWh | 720 kWh |
| Import tariff | $0.30/kWh | $0.33/kWh |
| Usage charge | $270.00 | $237.60 |
| Supply charge | $90.00 | $90.00 |
| Total | $360.00 | $327.60 |
Usage falls 20%, but the bill falls $32.40, or 9%, because the assumed tariff rises and the supply charge remains. Weather, occupancy and equipment use could also differ. This comparison does not isolate the effect of an upgrade or predict an annual saving.
What changes in a property calculator?
No calculator formula, government threshold or default changes because of this delivery milestone. The Rent-to-Income Ratio Calculator compares rent and income; electricity is not one of its inputs. Record utilities separately when checking the household budget.
The home energy upgrade payback worksheet distinguishes a cost paid by the owner from a saving received by the bill payer. A tenant's bill reduction should not be entered as an owner's investment income.
Sources and limitations
The DCCEEW release linked above was published 19 October 2026 and checked 20 October 2026. National counts are reported government figures, not an independent audit by RealEstateCalc. No property-level schedule or measured average saving is established here. The comparison table is invented to explain bill arithmetic.
General information only, not financial, legal, tax, credit or investment advice, an eligibility determination, rebate offer or energy saving guarantee. Confirm property-specific arrangements with the housing provider.
Last updated: 20 October 2026.
RealEstateCalc Editorial
Property & Finance ResearchThe RealEstateCalc editorial team researches and writes about Australian property, finance, and tax topics. All content is fact-checked against official sources including the ATO, state revenue offices, ASIC Moneysmart, and the RBA.
Related Calculators

Related Articles
NSW Social Housing Energy Upgrades: January 2027 Start Announced
The 13 September announcement adds $145.3m for NSW social housing energy upgrades. Check the delivery dates and keep projected savings out of current budgets.
Home Energy Upgrade Payback: A Quote and Savings Worksheet
Calculate simple payback from the cost you actually pay and an explicit annual cash saving. Check quote discounts, fixed charges and uncertain savings.
Ready to try the Rent-to-Income Ratio Calculator Australia?
Use the calculator to model an indicative estimate from the assumptions you enter.
What moved in Australian property this week — in your inbox Sunday.
RBA decisions, clearance rates, policy shifts and the calculators that dropped. Two-minute read, no filler.
Free. No spam. Unsubscribe anytime.