Dwelling Investment Rose 1.6% as Property Transfer Costs Fell
ABS National Accounts show dwelling investment rose 1.6% in the June quarter 2026 while ownership transfer costs fell 1.9%. See what each measure includes and what it cannot tell a buyer.
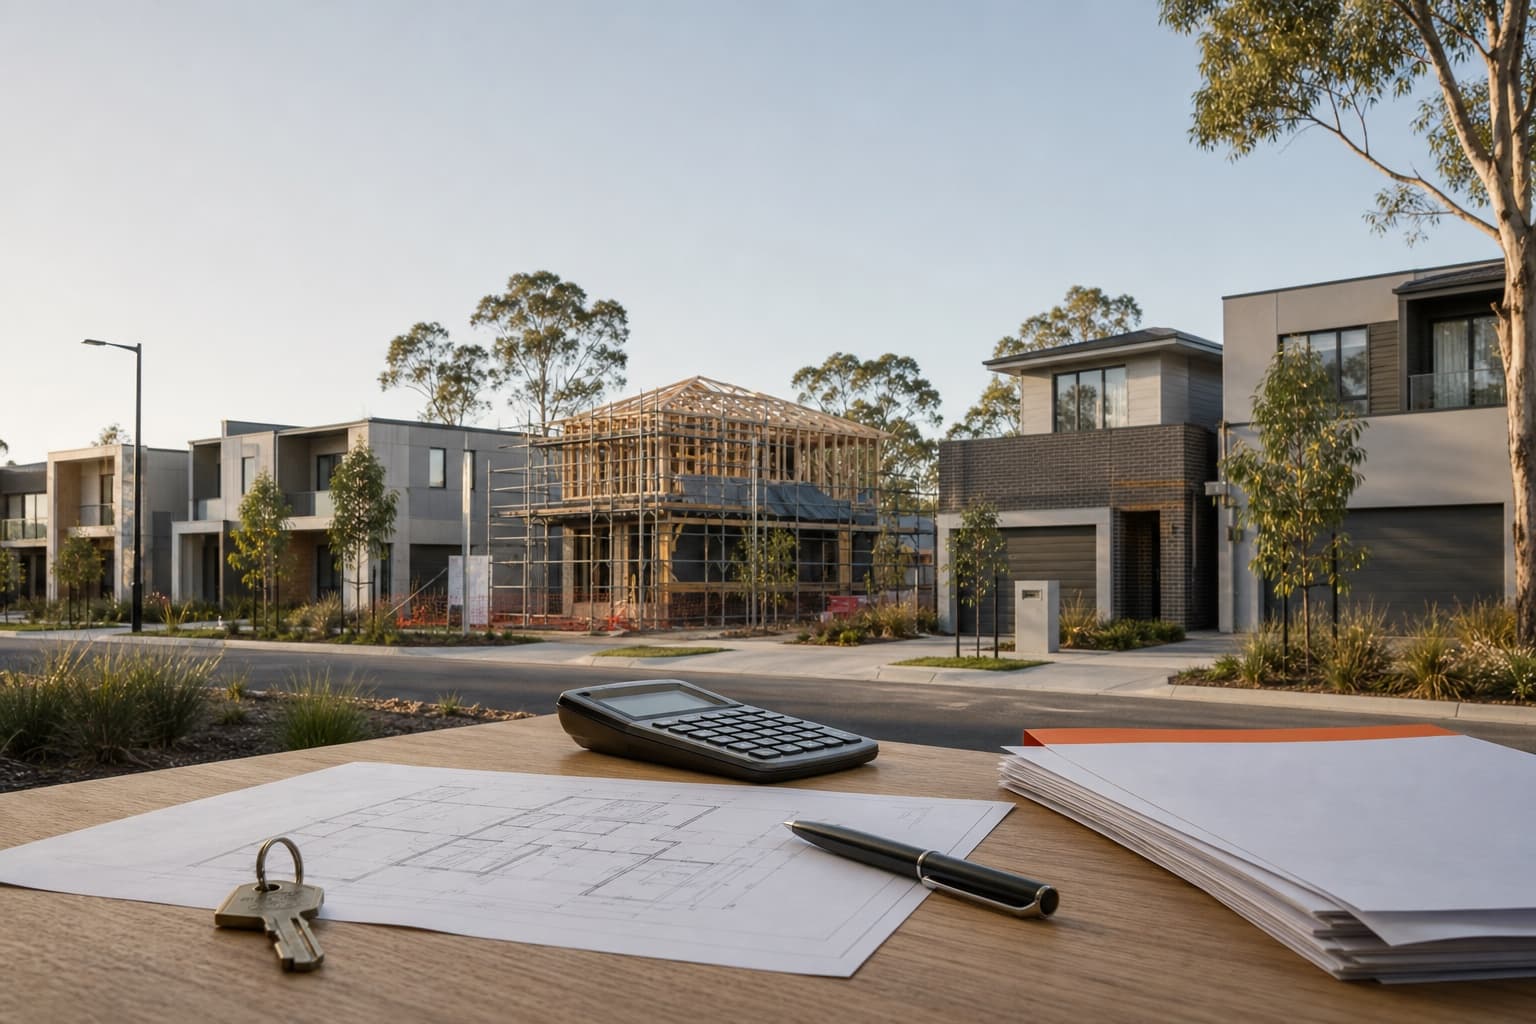
Try the Property Purchase Cost Calculator
Run the numbers while you read and see how the concepts apply to your situation.
Short summary
Australian private dwelling investment rose 1.6% in the June quarter 2026 and was 5.8% higher than a year earlier, according to National Accounts released by the Australian Bureau of Statistics on 2 September.
Ownership transfer costs moved in the other direction, falling 1.9% during the quarter. They remained 2.2% higher through the year.
These are seasonally adjusted chain volume measures for the economy. They do not mean a particular build became 1.6% more expensive or that stamp duty, conveyancing and agent fees fell 1.9% for an individual transaction. No RealEstateCalc formula changed because of this release.
The property figures at a glance
| National Accounts measure | June quarter movement | Through the year | Contribution to quarterly GDP growth |
|---|---|---|---|
| Private dwelling investment | +1.6% | +5.8% | +0.1 percentage points |
| Ownership transfer costs | -1.9% | +2.2% | Less than 0.05 percentage points |
| Non-dwelling construction | +4.1% | +7.6% | +0.2 percentage points |
| Construction industry gross value added | +0.4% | +4.2% | Not reported on the same table |
| Rental, hiring and real estate services gross value added | -0.5% | +2.6% | Not reported on the same table |
Australia's total gross domestic product rose 0.4% during the quarter and 2.1% through the year in seasonally adjusted chain volume terms. The household saving-to-income ratio edged up from 6.4% to 6.5%.
The property rows are components of a much larger national accounting system. They should stay labelled with their scope, reference period and adjustment.
What dwelling investment measures
In the National Accounts, dwelling gross fixed capital formation includes new dwellings, alterations and additions, and net acquisitions of existing dwellings under the ABS framework. Site clearing and preparation can form part of the cost of new dwellings. Incomplete construction is included to the extent that ownership is treated as having passed to the final user.
The ABS said dwelling construction rose in the June quarter, supported by the existing pipeline of work and new project commencements.
This is different from a dwelling approval. An approval is an administrative permit for proposed work. Investment records economic activity under National Accounts concepts. The July dwelling approvals update and June quarter residential building work update answer related but different questions.
It is also different from a construction quote. A 1.6% rise in the national chain volume series cannot be applied to one renovation, build contract or property value.
What ownership transfer costs include
The ABS ownership transfer cost category includes:
- fees paid to lawyers;
- fees and commissions paid to real estate agents, auctioneers, architects, surveyors, engineers and valuers;
- stamp duty; and
- local government transfer charges.
The category covers transfers involving dwellings, non-dwelling construction and unoccupied land. For its volume estimates, the ABS uses title transfer information and removes stamp duty exempt transfers where data is available. It uses other source data and estimates where direct information is unavailable.
Read the ownership transfer costs glossary entry for the full statistical definition and a comparison with a household purchase budget.
Why transfer costs can fall without fee rates falling
An economy-wide transfer-cost volume measure can fall when fewer relevant property transfers occur. It does not require every professional fee, commission rate or duty schedule to fall.
The ABS linked the June quarter decline to a slowing residential property market that coincided with rising interest rates and changes to taxation policies. That is a description of the quarter's data and context, not a claim that one factor caused every change in property activity.
Consider two simplified periods:
| Illustrative period | Property transfers | Average fees per transfer | Aggregate transfer activity |
|---|---|---|---|
| Period A | 10,000 | $25,000 | $250 million |
| Period B | 9,500 | $25,000 | $237.5 million |
Aggregate activity falls 5% in this illustration even though the fee attached to each transaction does not change. The ABS calculation is more detailed and this example does not reproduce it, but it shows why an aggregate fall is not an individual discount.
What a buyer or seller should calculate instead
A household estimate needs transaction-specific figures.
For a buyer, these can include:
- transfer duty based on the jurisdiction, dutiable value and supported buyer settings;
- conveyancing or legal fees from a current quote;
- building and pest reports;
- title, registration and settlement charges;
- loan costs and any lenders mortgage insurance; and
- moving and immediate repair allowances.
Use the Property Purchase Cost Calculator with current quotes and selections. Use the Stamp Duty Calculator for a separate duty estimate and check the relevant revenue authority before relying on a concession.
For a seller, use the Property Selling Costs Tool with the agreed agent commission, marketing, legal and discharge-cost assumptions. A national transfer-cost movement is not a substitute for the agency agreement or settlement statement.
What the figures do not establish
The release does not tell a reader:
- what one property is worth;
- whether a buyer can obtain finance;
- whether a dwelling project will be completed;
- whether transfer duty rates changed in a state or territory;
- whether one agent or conveyancer changed their fees;
- whether buying or selling is suitable for a person; or
- where property prices, rates or construction activity will move next.
Chain volume measures are designed to show changes in economic activity after removing price effects. They are not a cash budget. Recent seasonally adjusted estimates can also be revised as new information is incorporated.
What to watch next
The next National Accounts release is scheduled for 2 December 2026 and will cover the September quarter. Before then, monthly approvals and quarterly building activity releases will add information about different stages of the housing pipeline.
Keep those measures separate. Approvals, work done, commencements, completions, property transfers and National Accounts investment can move in different directions during the same period.
Sources
- ABS: Australian National Accounts, June quarter 2026, released 2 September 2026 and checked 3 September 2026.
- ABS media release: Australian economy grew 0.4% in the June quarter, released 2 September 2026 and checked 3 September 2026.
- ABS: Australian System of National Accounts, ownership transfer cost sources and methods, Edition 8, released 20 January 2026 and checked 3 September 2026.
General information disclaimer
This article provides general statistical information only. It is not financial advice, property advice, tax advice, legal advice, a construction quote, a duty assessment, a valuation or a recommendation to buy, sell, build or invest. Check current transaction costs with the relevant authority and licensed professionals before relying on an estimate.
Last updated: 3 September 2026.
Frequently asked questions
How much did Australian dwelling investment rise in the June quarter 2026?
The ABS reported a 1.6% quarterly rise in private dwelling investment in seasonally adjusted chain volume terms. It was 5.8% higher through the year.
Did property buying and selling fees fall 1.9%?
Not necessarily. The 1.9% fall is an economy-wide chain volume movement in ownership transfer costs. It does not show that one buyer or seller received a 1.9% reduction in stamp duty, conveyancing or agent fees.
What does the ABS include in ownership transfer costs?
The category includes specified legal and professional fees, real estate and auctioneer commissions, stamp duty and local government transfer charges across dwellings, non-dwelling construction and unoccupied land.
Did the National Accounts release change any calculator formula?
No. The release provides economy-wide statistical context and did not change a transfer duty rate, mortgage formula, fee schedule or calculator assumption.
RealEstateCalc Editorial
Property & Finance ResearchThe RealEstateCalc editorial team researches and writes about Australian property, finance, and tax topics. All content is fact-checked against official sources including the ATO, state revenue offices, ASIC Moneysmart, and the RBA.
Related Calculators

Property Purchase Cost Calculator
Estimate the total upfront costs of buying property in Australia, including stamp duty, government fees, legal costs, inspections, insurance, and moving expenses.
PropertyStamp Duty Calculator
Calculate stamp duty and government charges for property purchases across all Australian states and territories.
PropertyMortgage Repayment Calculator
Calculate mortgage payments, total interest, and view an amortisation schedule for your home loan.
FinanceRelated Articles
Australian Dwelling Approvals Fell 3.6% in July 2026
Australian dwelling approvals fell 3.6% to 17,687 in July 2026, while the trend estimate rose. See the dwelling-type, state and data-limit details.
Residential Building Work Rose 1.7% in the June Quarter
ABS preliminary data show residential building work rose 1.7% to $27.9 billion in the June quarter 2026. See how work done differs from approvals, starts and costs.
Building Approvals vs Commencements and Completions in Australia
A practical guide to Australian housing supply data: what building approvals, dwelling commencements, work under construction and completions each measure.
Ready to try the Property Purchase Cost Calculator?
Use the calculator to model an indicative estimate from the assumptions you enter.
What moved in Australian property this week — in your inbox Sunday.
RBA decisions, clearance rates, policy shifts and the calculators that dropped. Two-minute read, no filler.
Free. No spam. Unsubscribe anytime.