Residential Building Work Rose 1.7% in the June Quarter
ABS preliminary data show residential building work rose 1.7% to $27.9 billion in the June quarter 2026. See how work done differs from approvals, starts and costs.
Try the Property Purchase Cost Calculator
Run the numbers while you read and see how the concepts apply to your situation.
Short summary
The value of Australian residential building work done rose 1.7% to $27.9 billion in the June quarter of 2026, in seasonally adjusted chain volume terms, according to preliminary ABS data released on 26 August.
Residential work was 9.1% higher than a year earlier. Total building work, including residential and non-residential projects, rose 1.3% during the quarter to $45.8 billion.
This release measures construction activity completed during the period. It does not count dwelling approvals, commencements or completed homes, and the dollar figures are not current-price project revenue. The preliminary estimates are subject to revision.
Read the approvals, commencements and completions guide before comparing different housing-pipeline releases. Use the Property Purchase Cost Calculator for indicative transaction costs, not construction activity.
The later June quarter National Accounts property update records a separate dwelling investment measure and explains why ownership transfer costs are not a household fee quote.
What changed in the June quarter
| Seasonally adjusted chain volume measure | June quarter 2026 | Quarterly movement | Annual movement |
|---|---|---|---|
| Residential building work | $27.87 billion | +1.7% | +9.1% |
| Non-residential building work | $17.98 billion | +0.5% | +11.5% |
| Total building work | $45.84 billion | +1.3% | +10.0% |
| Engineering construction | $36.67 billion | -6.0% | -5.1% |
| Total construction work | $82.52 billion | -2.1% | +2.7% |
The national construction headline fell because the decrease in engineering work was larger than the increase in building work. That does not mean residential activity fell. The residential component moved in the opposite direction.
The ABS trend estimate also showed residential building work rising, by 1.0% during the quarter and 7.1% over the year. Seasonally adjusted and trend series use different methods, so each result should keep its label.
What "work done" measures
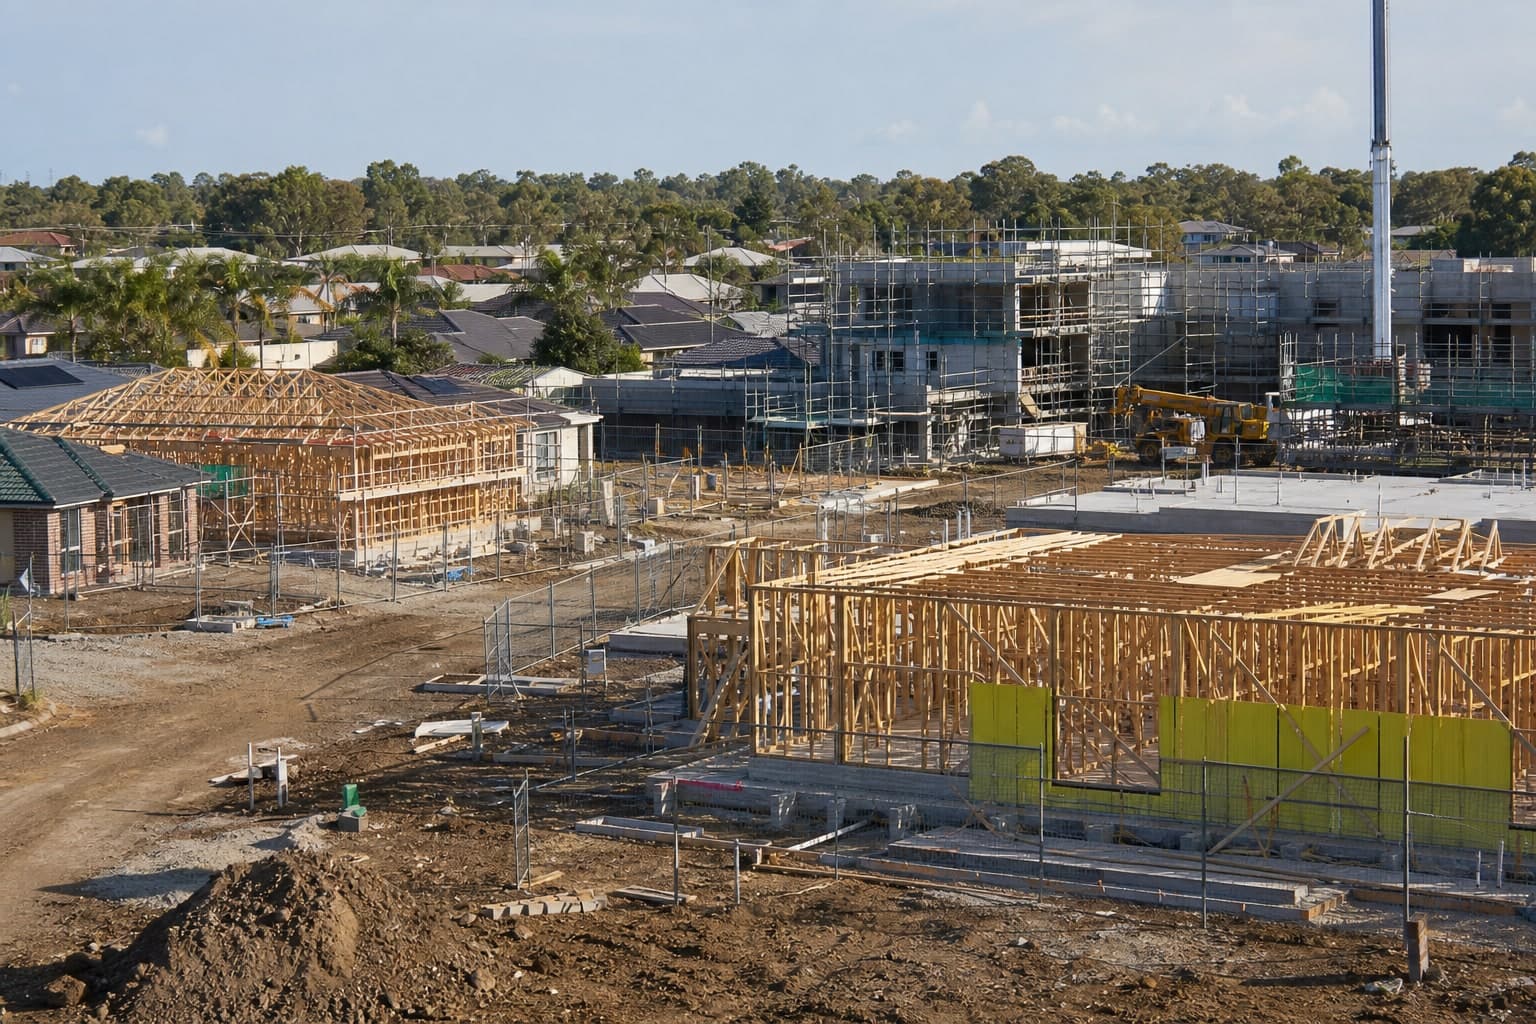
Construction work done is an activity measure. It estimates the value of physical construction completed during the quarter.
The ABS reports the headline results as chain volume measures. These are adjusted to remove the direct effect of price changes, with 2023-24 as the reference year for this release. That makes the series more useful for comparing the volume of activity through time.
It is different from:
- building approvals, which record projects approved by relevant authorities;
- dwelling commencements, which record new residential projects that started;
- dwellings under construction, which count dwellings still in the pipeline;
- dwelling completions, which count dwellings completed during the period; and
- construction price indexes, which measure changes in input or output prices.
A project can contribute to work done over several quarters. One apartment development can add a large amount of activity without producing the same number of completed homes in that quarter.
Why the result does not equal new housing supply
The quarterly increase is useful evidence that more residential construction activity occurred. It cannot show how many homes became available to occupy.
Work can remain incomplete because a project still needs later construction stages, services, approvals, defect work or settlement. Some residential work may also relate to alterations and additions rather than a new dwelling.
The latest detailed dwelling commencements and completions series still refers to the March quarter. The March dwelling starts update records 48,012 seasonally adjusted commencements. The two releases should not be combined as if they cover the same reference period or measure the same thing.
For the wider supply target, the National Housing Accord progress update keeps approvals, commencements, work under construction and completions separate.
A practical pipeline example
Consider a 60-apartment project that began during the March quarter.
The project may contribute to residential work done as excavation, structure, services and fit-out are completed across several quarters. It is still one project with 60 proposed dwellings. The value of work done can rise before any apartment is counted as completed.
If construction pauses, the project may remain in the under-construction count while contributing less work in the next quarter. If it finishes, the dwellings enter the completion series. Approval, activity and completion are stages, not interchangeable measures.
This is why a 1.7% rise in residential work done should not be described as a 1.7% rise in housing supply.
What the state totals can and cannot show
The release also reports total construction work by state and territory. Victoria recorded the largest quarterly increase at 5.8%, while Western Australia recorded the largest fall at 19.7%.
Those figures include building and engineering construction. They are not state residential-only results in the headline table. A major transport, mining or utilities project can move a state's total sharply.
The figures also do not show construction progress in one suburb, the quality of a development, the value of a particular home or the time remaining on one building contract.
Does this change a building budget?
No. Work-done data is not a construction price index or a builder quote.
For broad price movements, read the June quarter house construction prices update. For a live project, current plans, site conditions, inclusions, provisional sums, variations and quotes matter more than a national activity total.
The house build timeline and delay costs guide can help organise holding-cost scenarios. It does not predict a completion date or interpret a contract.
Preliminary-data limitations
The ABS describes this release as an early indication of construction activity. Its response rate was about 80% of surveyed construction entities for the quarter.
The estimates can be revised when more complete Engineering Construction Activity data is released on 30 September 2026 and Building Activity data is released on 7 October 2026. Release dates can change.
No RealEstateCalc formula changed because of this release. It did not alter stamp duty, mortgage, tax, lending or construction-cost assumptions.
Sources
- Australian Bureau of Statistics: Construction Work Done, Australia, Preliminary, June 2026, released 26 August 2026 and checked 30 August 2026.
- Australian Bureau of Statistics: Building Activity, Australia, March 2026, including the definitions and latest detailed dwelling-pipeline reference period. Checked 30 August 2026.
General information disclaimer
This article provides general information about an official statistical release. It is not financial, property, building, engineering, legal or investment advice. The data is preliminary, aggregate and subject to revision. It is not a project quote, valuation, completion forecast, housing-supply forecast or recommendation. Check current ABS data and project-specific information before relying on an amount.
Last updated: 30 August 2026.
Frequently asked questions
How much did Australian residential building work rise in the June quarter 2026?
Seasonally adjusted residential building work rose 1.7% to $27.87 billion in chain volume terms. It was 9.1% higher than a year earlier.
Does work done count completed dwellings?
No. It measures construction activity completed during the quarter. One project can contribute work over several quarters before its dwellings are counted as completed.
Why did total construction fall while residential work rose?
Engineering construction fell 6.0%, which outweighed increases in residential and non-residential building work. The components moved in different directions.
Are the June construction figures final?
No. The ABS labels them preliminary and says they are subject to revision when detailed building and engineering releases become available.
RealEstateCalc Editorial
Property & Finance ResearchThe RealEstateCalc editorial team researches and writes about Australian property, finance, and tax topics. All content is fact-checked against official sources including the ATO, state revenue offices, ASIC Moneysmart, and the RBA.
Related Calculators

Property Purchase Cost Calculator
Estimate the total upfront costs of buying property in Australia, including stamp duty, government fees, legal costs, inspections, insurance, and moving expenses.
PropertyInflation Calculator Australia
Model how a constant assumed annual inflation rate changes an amount over time. This is a scenario tool, not a historical CPI lookup.
FinanceRelated Articles
Building Approvals vs Commencements and Completions in Australia
A practical guide to Australian housing supply data: what building approvals, dwelling commencements, work under construction and completions each measure.
Australian Dwelling Starts Fell 11.2% in the March Quarter 2026
ABS data shows seasonally adjusted dwelling commencements fell in the March quarter, while the less volatile trend series still rose.
Council Projects Housing Accord Target for Late 2030
The National Housing Supply and Affordability Council now projects the 1.2 million-home Accord target will be reached in the December quarter 2030. See the state progress and data limits.
Ready to try the Property Purchase Cost Calculator?
Use the calculator to model an indicative estimate from the assumptions you enter.
What moved in Australian property this week — in your inbox Sunday.
RBA decisions, clearance rates, policy shifts and the calculators that dropped. Two-minute read, no filler.
Free. No spam. Unsubscribe anytime.